
Georgia’s consumer prices fell 0.4% in July from June while the annual inflation rate eased only to 5.5%, according to the National Statistics Office. Seasonal vegetable declines drove the monthly drop, yet transport and housing kept the yearly figure nearly double the National Bank’s 3% target.
The print leaves core pressures intact and the policy rate elevated, raising the real cost of credit even as grocery bills soften for a month.
Vegetables Led the Monthly Price Decline
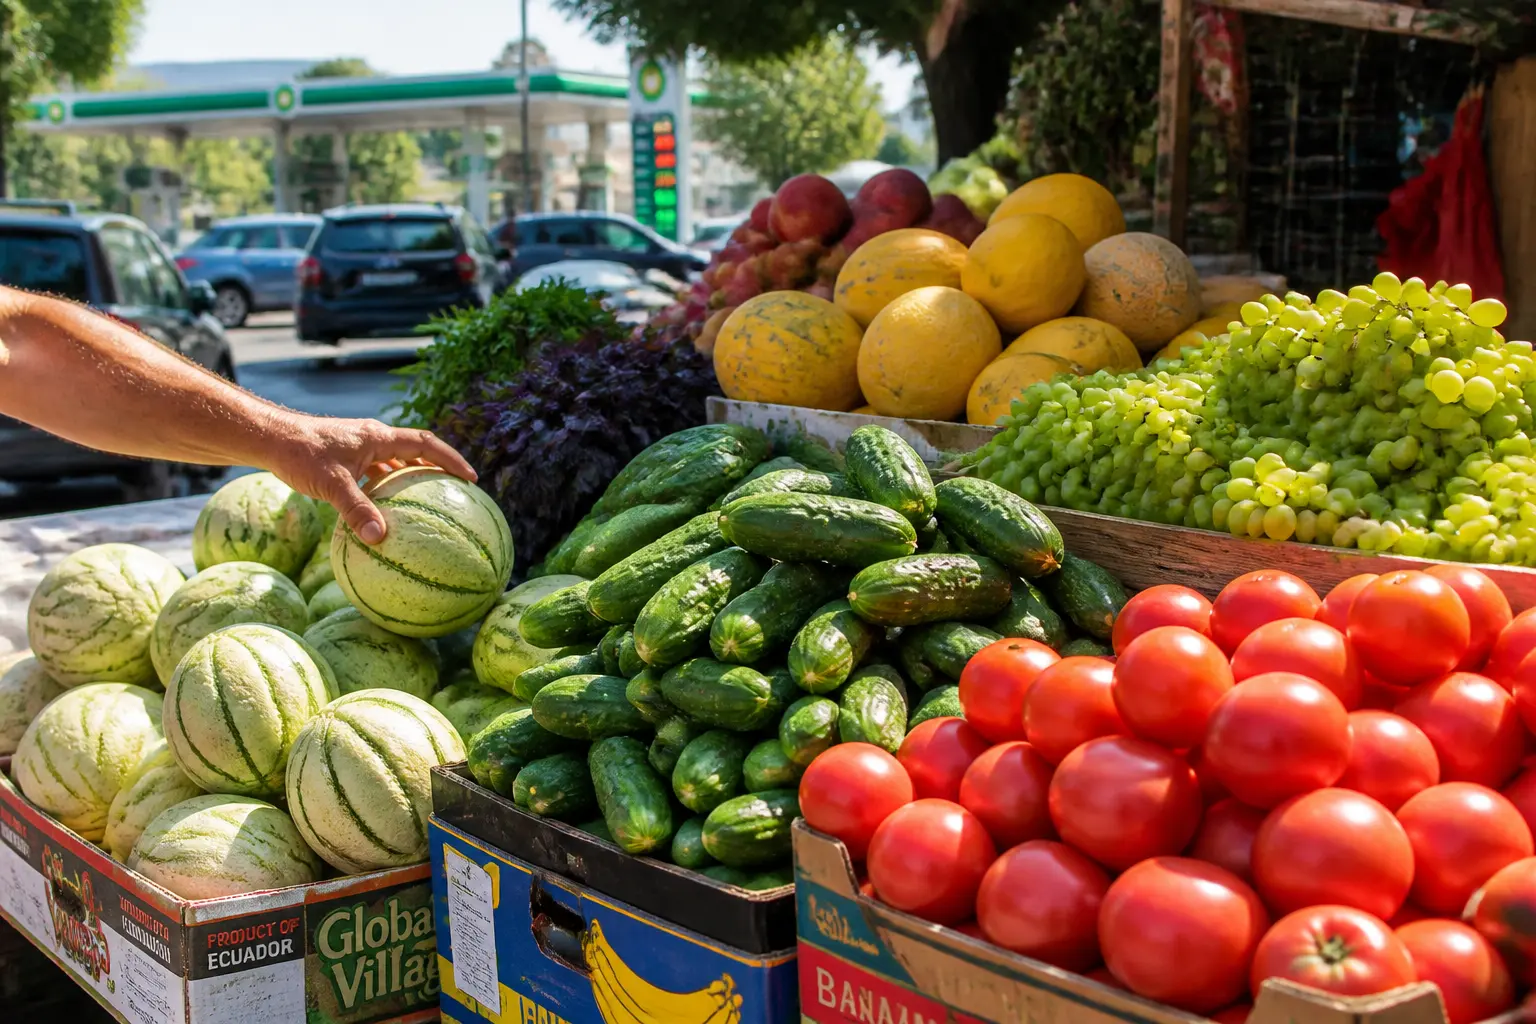
Food and non-alcoholic beverages fell 0.9% month-on-month and subtracted 0.3 percentage points from the headline. Vegetables and melons plunged 12.3%. Fruits and grapes dropped 2.8%. Sugar, jam and confectionery eased 0.8%, soft drinks 0.5%, meat 0.3% and fish 0.1%.
Coffee, tea and cocoa rose 2.3%. Milk, cheese and eggs climbed 2.1%. Oils and fats gained 1.2% and bread 0.7%. Clothing and footwear dropped 4.9% overall (clothing -6.4%, footwear -2.4%) and cut another 0.22 points. Housing, water, electricity, gas and fuels rose 0.8%, adding 0.08 points, mainly from actual rentals up 2.3% and dwelling maintenance up 1.3%.
| Group | Monthly change | Contribution (pp) |
|---|---|---|
| Food and non-alcoholic beverages | -0.9% | -0.3 |
| Clothing and footwear | -4.9% | -0.22 |
| Housing, water, electricity, gas and fuels | +0.8% | +0.08 |
The official July 2026 inflation release confirms the same breakdown published by Geostat on 3 August.
Transport and Housing Still Drive the Annual Rate
Annual inflation of 5.5% was led by food up 4.9% (contribution 1.74 points) and transport up 14.2% (1.66 points). Housing, water, electricity, gas and fuels rose 8.3% and added 0.8 points. Health rose 4.7% (0.4 points). Restaurants and hotels, miscellaneous goods and alcoholic beverages also posted solid gains. Communication fell 6.3%.
- Fish +18.2% year-on-year
- Operation of personal transport +20.1%
- Electricity, gas and other fuels +10.4%
- Meat and meat products +9.2%
Vegetables and melons were the clear annual outlier, down 5.7%. Core inflation stood at 3.8% (3.5% excluding tobacco). The gap between headline and core shows energy and food still dominate the overshoot.
How the Basket Translates Price Moves into Household Bills
Geostat’s 2026 consumer basket weights of 33.6% for food make vegetable swings powerful. Transport carries 11.4% and housing-related items 9.7%. Healthcare holds 8.3%. Prices are collected mid-month across six cities at more than 1,800 outlets from a fixed 305-item basket updated yearly.
- Food and non-alcoholic beverages: 33.6%
- Transport: 11.4%
- Housing, water, electricity, gas and other fuels: 9.7%
- Healthcare: 8.3%
- Clothing and footwear: 4.3%
A 12% vegetable drop therefore moves the national index more than a larger percentage rise in a small-weight category. Drivers and renters feel the opposite side of the same arithmetic every month.
The National Bank Stays on Hold
On 29 July the Monetary Policy Committee kept the refinancing rate at 8.25 percent. June headline inflation had been 5.8%. Energy prices linked to Middle East tensions remained the main driver. Core (ex food, energy, tobacco) was 3.2% in June while services inflation accelerated to 4.1%.
According to the NBG’s updated central scenario, energy prices are expected to remain a significant contributor to inflation this year. Consequently, average inflation is projected at 5.2 percent in 2026. From the second half of 2026 onwards, inflation is expected to decline gradually and converge to the 3 percent target over the medium term.
The bank said the tight stance will stay in place for an extended period and that it stands ready to tighten further if second-round effects strengthen. Growth is still forecast at 6.5% for 2026, supported by high-productivity services.
Who Absorbs the Sticky Costs
Households that spend heavily on fuel, public transport and rent face the annual load even while seasonal produce cheapens. Actual rentals rose 8.2% year-on-year and electricity/gas 10.4%. Operation of personal transport equipment jumped 20.1%. Fixed-income and lower-wage groups see real purchasing power erode faster under a 5.5% headline than the monthly grocery relief suggests.
Businesses face higher input and financing costs while the policy rate stays elevated. Credit demand normalises only slowly. Geostat’s other recent releases, from Geostat passenger turnover figures to earlier Geostat cultural statistics, show the same office tracking both expansion and squeeze across the economy.
Recent Path of the Annual Rate
- February 2026: annual inflation 4.6%
- April 2026: peaked near 5.9% after energy shock, prompting the 25 bp rate hike to 8.25%
- June 2026: 5.8%
- July 2026: 5.5%
The Geostat consumer price index series shows the 12-month average still elevated relative to the quiet years of 2023-24. July’s monthly decline is the first clear seasonal counterweight after several months of energy-driven stickiness.
What the Second Half Still Carries
NBG’s central scenario already assumes energy remains a large contributor through 2026 and that average inflation lands at 5.2%. Convergence to 3% is pushed into the medium term. High-inflation risk scenarios keep open the chance of further rate hikes if geopolitical tensions lift oil again or if services inflation feeds expectations. Low-inflation paths require faster de-escalation and stronger supply-side growth.
July’s vegetable collapse gives temporary breathing room on the grocery bill. It does not remove the transport and housing components that dominate the annual overshoot and that keep the refinancing rate high. Borrowers and renters will feel those effects longer than shoppers feel the melon discount.
Frequently Asked Questions
What is the National Bank of Georgia’s inflation target?
The NBG aims to keep the overall price level increase close to 3 percent over the medium term. Headline inflation has run above that level for most of 2026, prompting the current 8.25 percent policy rate.
How is Georgia’s CPI basket weighted?
The 2026 basket contains 305 goods and services. Food and non-alcoholic beverages carry 33.6 percent, transport 11.4 percent and housing-related items 9.7 percent. Weights are updated annually from national accounts and household survey data.
What caused the July 2026 monthly CPI decline?
Vegetables and melons fell 12.3 percent and clothing prices dropped 4.9 percent. Those two groups alone more than offset small rises in housing and selected food items such as dairy and coffee.
How does core inflation differ from the headline rate?
Core inflation excludes food, energy and tobacco. In July it stood at 3.8 percent (3.5 percent excluding tobacco only), showing that much of the 5.5 percent headline overshoot comes from the volatile groups the bank watches for second-round effects.
Where and how often does Geostat collect prices?
Prices are registered from the 10th to the 20th of each month in Tbilisi, Kutaisi, Batumi, Gori, Telavi and Zugdidi at more than 1,800 retail outlets. The official release is on the third day of the following month.