
Astronomers using Hubble data have charted star formation across most of the Andromeda Galaxy and found its rate has fallen roughly 80 percent over the past 500 million years, with the steepest drop in the last 40 million years. The galaxy now forms stars at about one-fifth of a solar mass per year, a clear slide from a more active past into what researchers call a quieter middle-age phase.
The map, built from roughly 200 million individual stars, also reveals a near-dead patch closest to the compact satellite M32 and shows why the usual tools for distant galaxies can misread a system that is changing fast.
The 500-Million-Year Drop in Plain Numbers
Lead author Tobin Wainer of the University of Washington and colleagues combined the older Panchromatic Hubble Andromeda Treasury (PHAT) survey of the northern disk with the newer Panchromatic Hubble Andromeda Southern Treasury (PHAST). Together the surveys cover about two-thirds of Andromeda’s star-forming disk.
Five hundred million years ago the galaxy converted roughly one solar mass of gas into stars each year. By 40 million years ago that rate had halved to about 0.5 solar masses per year. The present-day rate sits near 0.2 solar masses per year, according to the NASA Hubble release on the decline.
| Lookback time | Approx. disk SFR (solar masses/yr) | Notes |
|---|---|---|
| ~500 Myr ago | ~1.0 | Post-burst recovery still active |
| ~40 Myr ago | ~0.5 | Clear global decline underway |
| Last 100 Myr average (joint footprint) | 0.445 ± 0.006 | Extrapolates to ~0.67 full disk |
| Last 20 Myr average (joint footprint) | 0.285 ± 0.014 | Extrapolates to ~0.43 full disk |
| Present-day estimate | ~0.2 | ~80% below 500-Myr level |
Inside the combined footprint the team measured those precise averages; scaling by the fraction of far-ultraviolet light covered yields the full-disk estimates. The numbers appear in the full PHAST II analysis in ApJ published 27 July 2026.
Wainer put the long decline in everyday terms: “It’s just like after running a marathon, sometimes you’ve got to take a bit of a breather.”
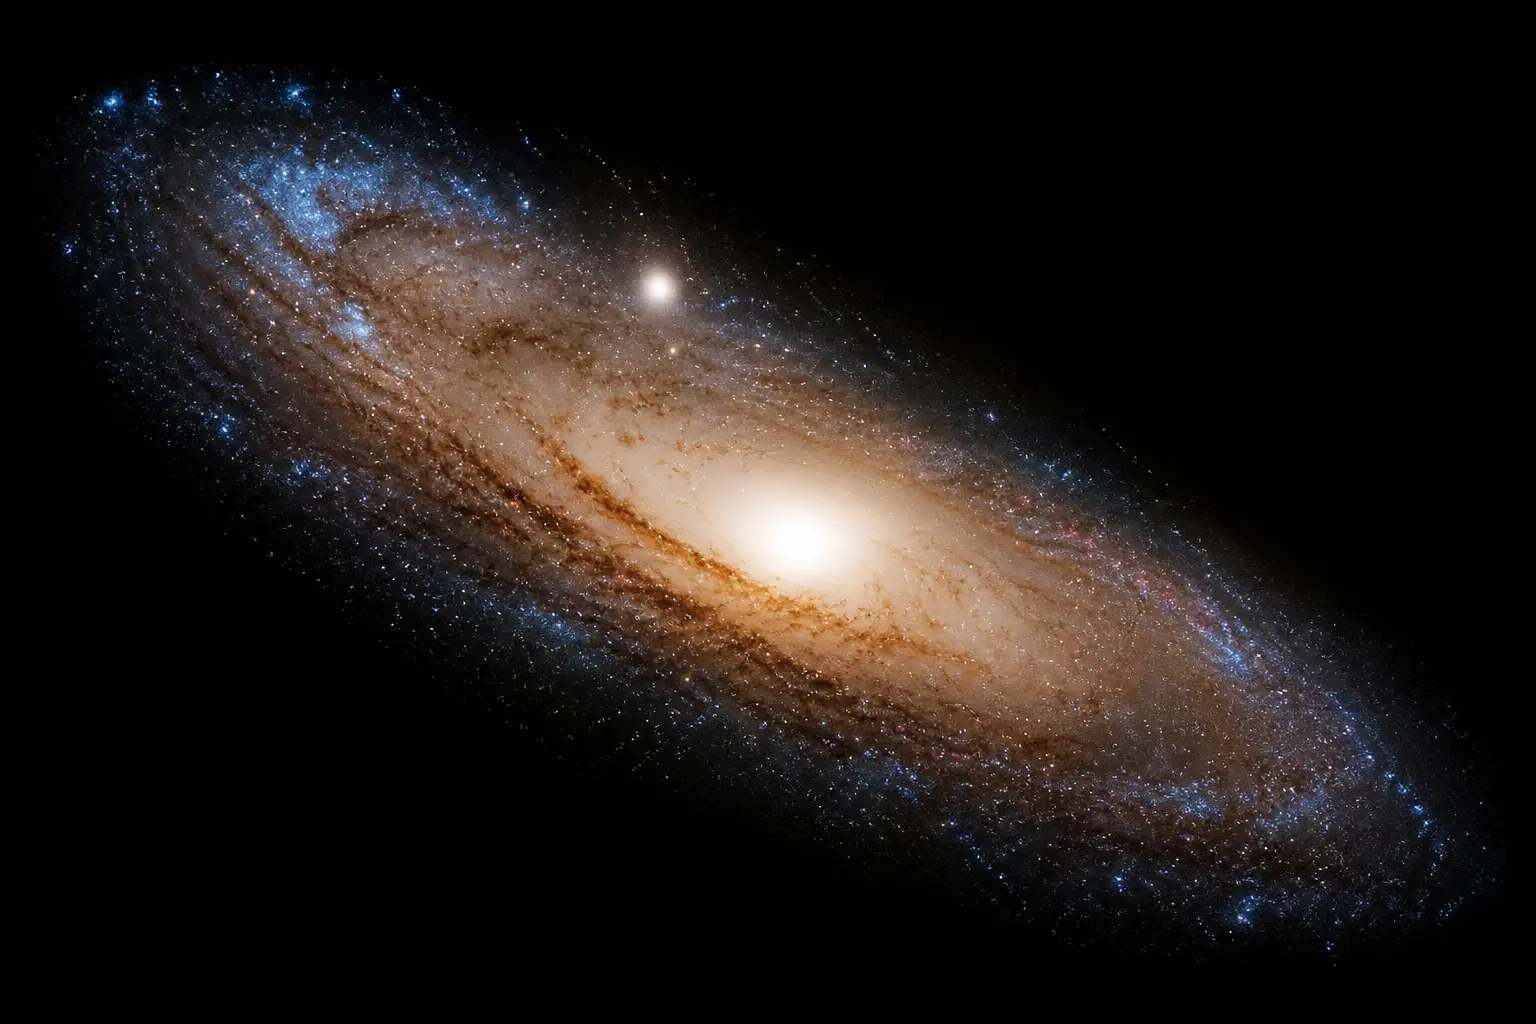
Rings Still Hold Most of the Fire
Recent star formation is not spread evenly. Most of it sits in a ring about 32,000 light-years from Andromeda’s center. That ring’s fading output drives the global drop.
The team found no sign that Andromeda has simply run out of gas and dust. The raw material remains. What has changed is the dynamical ability to turn that material into stars, a natural wind-down after an earlier, more vigorous epoch.
- Star formation still traces the ringed morphology of the disk at high spatial resolution.
- The global decline is driven mainly by decreasing activity inside those rings.
- A modest enhancement around 100 million years ago sits on top of the longer multi-gigayear slide.
- Previous work already showed a major burst about 2 billion years ago, almost certainly after a merger or strong interaction.
The new maps simply extend that story into the most recent half-billion years with uniform methods across both northern and southern disks.
M32 and the Quiet Patch Nearby
PHAST deliberately covered the southern disk nearest the compact satellite M32. There the data show a clear local suppression of new stars that does not appear elsewhere at the same strength.
The quieting near M32 appears to have begun roughly 60 million years ago. Wainer was careful: “We can’t explicitly say that we are seeing a decrease in star formation because of M32. But it’s right there, and it’s definitely the most likely suspect.”
M32 sits only about 16,000 light-years away in projection. Its true three-dimensional distance remains uncertain, so astronomers still debate whether (and when) it punched through Andromeda’s disk. The satellite’s own stripped appearance already hints at past violence. The new star-formation “dead zone” supplies an independent timing clue that future dynamical models can test.
Co-author Zhuo Chen of the University of Washington noted that probing the M32-disk interaction was a major motivation for the southern survey in the first place.
How Color-Magnitude Diagrams Read the Fossil Record
Massive stars burn hot and blue and die in only a few million years. Lower-mass stars glow redder and last far longer. By dividing the galaxy into thousands of cells roughly 300 light-years on a side and fitting the color-magnitude diagram of the stars inside each cell, the team reconstructed how many stars of each age formed in each patch.
Hubble’s sharp resolution over a wide area is essential. Ben Williams of the University of Washington, a co-author, said: “We need to measure the individual stars because they are the fossil record of the galaxy’s formation. Hubble is the only telescope that can give you high enough spatial resolution over a large enough area to be able to do that in Andromeda.”
The method reaches back about 500 million years with good time resolution. Older ages become harder because the age-sensitive features on the diagram grow less distinct. The result is the highest-resolution, spatially resolved recent star-formation history yet measured for any massive spiral.
Why Distant Snapshots Can Lie
Here the second-order payoff appears. Astronomers routinely estimate star-formation rates in far-away galaxies with far-ultraviolet light plus mid-infrared dust emission. Those tracers effectively average over roughly 100 million years.
When the team compared their star-by-star rates with the standard FUV+24 µm prescriptions, the FUV calibration underestimated the true 100-Myr average by a factor of about 2.1. Yet a synthetic FUV image built from the CMD-derived histories matched the real Galaxy Evolution Explorer observations well. The histories themselves are accurate; the averaged tracer simply cannot keep up when the rate is changing quickly.
The mismatch with the FUV+24 µm estimates underscores that tracers implicitly averaged over ∼100 Myr are not reliable when the recent SFR is evolving.
That sentence from the paper is the quiet warning for the rest of extragalactic astronomy. Most galaxies we study lie far beyond the Local Group. If many of them are also winding down or recovering from bursts, single-epoch tracer measurements can give a false picture of their health. Andromeda is the nearest massive laboratory where the error can be measured directly and then used to recalibrate the tools.
Green Valley Neighbors and a Coin-Toss Future
At roughly 0.2 solar masses per year, Andromeda sits in or near the “green valley,” the sparsely populated transition zone between blue, star-forming spirals and red, quiescent ellipticals. Large surveys show galaxies cluster at the two extremes; few linger in the middle. Understanding what pushes a galaxy across that valley remains a central problem.
Andromeda and the Milky Way are similar in mass and size, yet Andromeda’s recent merger history has been more active. The Milky Way appears to have lived a quieter life. Both are bound to the Local Group. Updated measurements that include the Large Magellanic Cloud and M33 give the pair only 50-50 collision odds within 10 billion years. A head-on smash in the next 4-5 billion years is now estimated at roughly 2 percent. If they do merge, the remnant is expected to become a giant elliptical that forms few new stars.
- ~2 billion years ago, major star-formation burst, likely merger-driven.
- ~500-100 million years ago, steady multi-Gyr decline continues, with a modest 100-Myr bump.
- ~60-40 million years ago, steeper drop, strongest near M32; ring activity fades.
- Today, SFR ~0.2 solar masses per year; green-valley transitional state.
- Next several Gyr, continued wind-down unless a future interaction restarts the cycle; possible MW encounter still a coin toss.
An astronaut view of Andromeda from orbit already shows the familiar spiral we can see with the naked eye from dark sites. The new maps simply reveal that the spiral is no longer as busy as it once was.
NASA’s Nancy Grace Roman Space Telescope, scheduled for launch as early as late August 2026, will finish what Hubble started. Its wide field can cover Andromeda’s entire disk and parts of the halo in far fewer pointings, measuring hundreds of millions more stars and extending the same fossil-record method across the whole system.
For now the 200-million-star census stands as the clearest picture yet of a massive spiral catching its breath. The rings still glow, M32 still hovers nearby, and the standard yardsticks used on distant galaxies have a measured bias that can finally be corrected. Andromeda’s middle age is not just a local story. It is a calibration point for the lives of galaxies everywhere.
Frequently Asked Questions
How much has Andromeda’s star-formation rate actually fallen?
Over the last 500 million years the rate dropped from roughly one solar mass per year to about 0.2 solar masses per year, an 80 percent decline; the joint PHAT+PHAST footprint averages 0.445 solar masses per year over 100 Myr and 0.285 over the last 20 Myr before full-disk scaling.
What is the green valley in galaxy evolution?
It is the transitional zone on color-mass diagrams between the blue cloud of actively star-forming spirals and the red sequence of quenched ellipticals; few galaxies linger there, so objects like Andromeda that occupy it offer rare nearby views of the quenching process itself.
Why do standard star-formation tracers underestimate Andromeda?
Far-ultraviolet plus 24-micron prescriptions average over about 100 million years; when the true rate is falling fast they under-predict the CMD-based 100-Myr average by a factor of roughly 2.1 even though the CMD histories correctly reproduce the observed FUV light.
Did M32 cause the recent drop near it?
The data show a clear local suppression that began about 60 million years ago and is strongest closest to M32, making the satellite the most likely suspect, yet the team stops short of a definitive causal claim because M32’s exact three-dimensional path is still uncertain.
Will the Milky Way and Andromeda definitely collide?
Updated simulations that include the Large Magellanic Cloud and M33 give only about a 50 percent chance of a merger within the next 10 billion years and roughly a 2 percent chance of a head-on collision in the next 4-5 billion years.