Alaska’s thawing permafrost is already driving tens of billions in local infrastructure damage while unlocking ancient carbon stores that a 2015 model linked to additional $43 trillion in economic damage by 2200. The ground under roads, clinics and homes is shifting now. The carbon feedback is global and still uncertain in scale.
Federal risk indexes largely skip the hazard. New high-resolution mapping and recent Arctic observations show the costs landing first on remote communities.
The Carbon Locked Under Alaska’s Tundra
Permafrost is ground that stays at or below 0 °C for at least two consecutive years. In the Arctic it holds the remains of plants and animals frozen for thousands of years. Cold slowed decay and left vast organic carbon in place.
The 2015 Cambridge and Colorado study put the Arctic total near 1,700 gigatonnes of carbon in frozen organic matter. Later work often describes the northern permafrost region as storing roughly twice the carbon now in the atmosphere. As long as the ground stays frozen, most of that carbon stays put.
Warming changes the balance. Microbes wake up, break down the organic material and release carbon dioxide and methane. Alaska sits inside the continuous and discontinuous permafrost zones where this process is accelerating.
- 1,700 Gt C: approximate frozen organic carbon stock used in the 2015 economic model
- Twice atmosphere: common recent description of northern permafrost carbon holdings
- 2-4× faster: Arctic warming rate relative to the global average
- Second-warmest: 2024 Alaskan permafrost temperatures at long-term stations
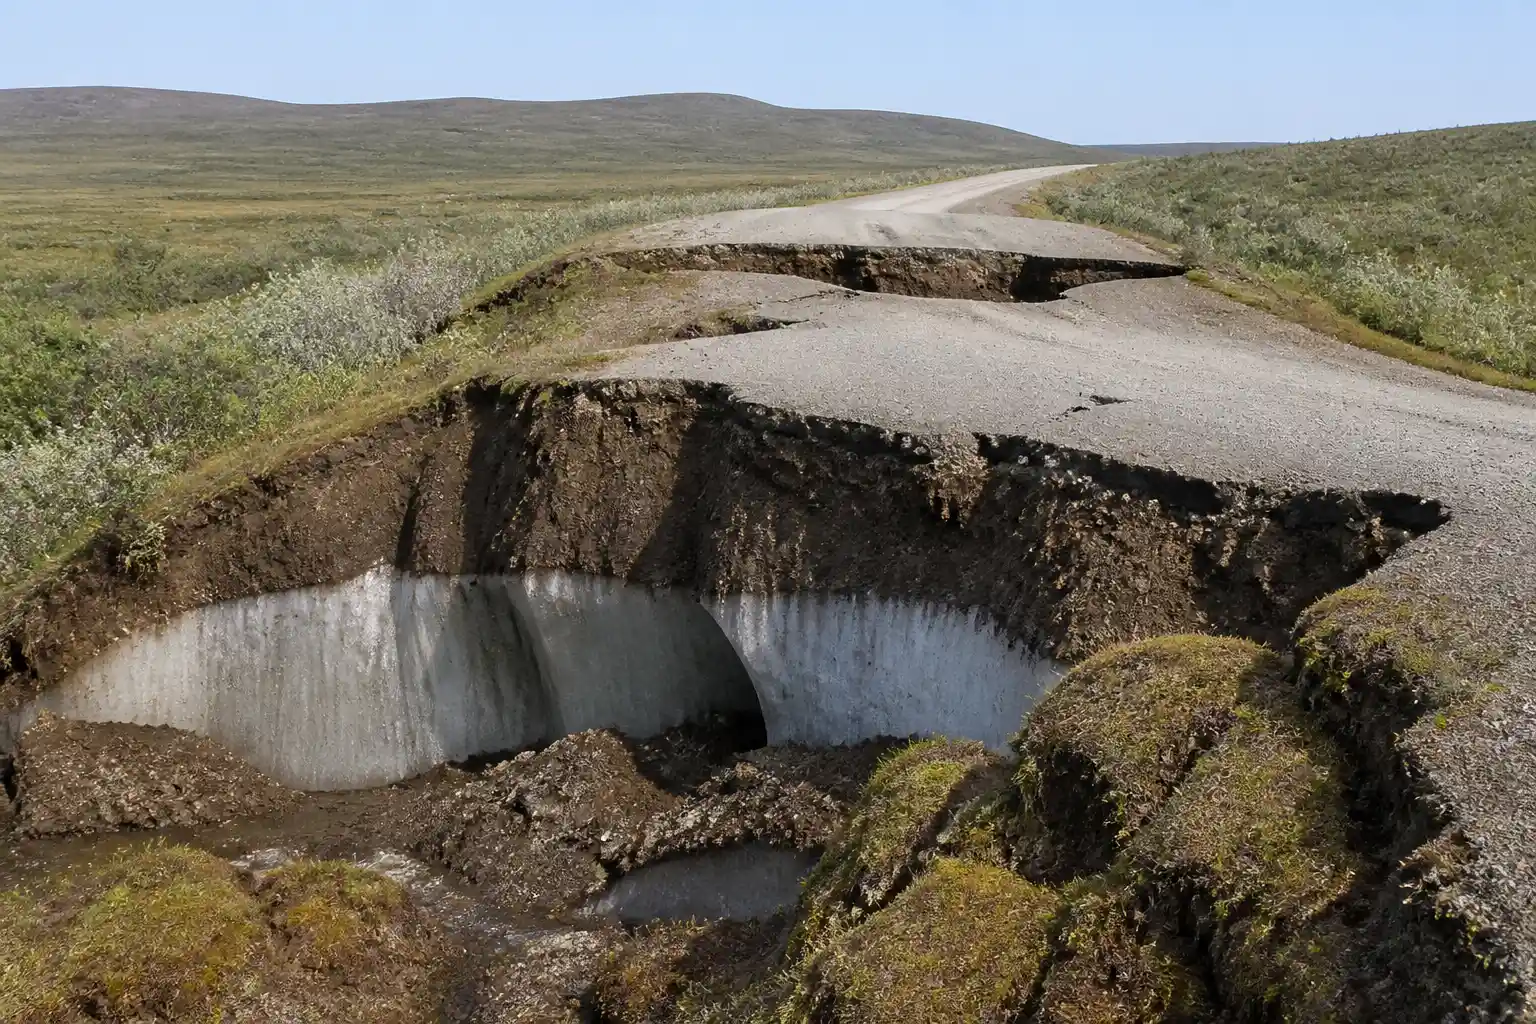
The same frozen ground also supports buildings and roads. When ice-rich soil thaws, the surface can subside unevenly and foundations lose bearing capacity.
That dual role matters for any cost ledger. Carbon release sets the long atmospheric bill. Loss of bearing capacity sets the near-term local one. Both stem from the same temperature threshold crossed in ice-rich ground.
How a 2015 Model Reached $43 Trillion
Chris Hope of Cambridge Judge Business School and Kevin Schaefer of the National Snow and Ice Data Center ran the PAGE09 integrated assessment model. They added estimated CO2 and methane releases from thawing permafrost to a business-as-usual pathway.
Under the study’s A1B scenario the net present value of climate impacts by 2200 rose from $326 trillion to $369 trillion, an increase of about 13 percent or $43 trillion. Roughly $33 trillion of the extra damage was attributed to carbon dioxide and about $8 trillion to methane.
| Metric | Value |
|---|---|
| Base climate damage NPV by 2200 | $326 trillion |
| With permafrost emissions | $369 trillion |
| Additional damage | $43 trillion (~13%) |
| Uncertainty range | $3 trillion to $166 trillion |
| Potential reduction via aggressive cuts | up to $37 trillion |
Hope said the results showed the need for urgent action to slow melting and limit greenhouse-gas release. The wide range reflected different assumptions on emissions, climate sensitivity and damage functions. Later studies using different models and nonlinear feedbacks have produced both lower and higher add-ons depending on the pathway.
The split between gases is itself a policy signal. Carbon dioxide dominated the extra damage tally, yet methane still contributed about $8 trillion in the same run. Any strategy that slows thaw therefore cuts two distinct warming agents at once, which is why the model’s aggressive-cut case trimmed so large a share of the add-on.
Roads and Clinics Already Sinking
A March 2025 study in Communications Earth & Environment used deep-learning detection on 0.5 m satellite imagery across 285 Alaskan communities. Combined with OpenStreetMap it produced a statewide building footprint of 53 million square meters and a road network of 50,477 km. The improved inventory roughly doubled earlier infrastructure counts on continuous and discontinuous permafrost.
The authors estimated building and road losses of $37 billion to $51 billion under SSP245 and SSP585 scenarios between the decades 2015-2024 and 2055-2064. Roads accounted for roughly 65 to 69 percent of the total. Per-capita costs in some communities ran into the millions of dollars.
| Scenario | Total estimated cost | Buildings at risk (approx.) | Roads at risk (approx.) |
|---|---|---|---|
| SSP245 | $37 billion | 10.4 M m² (~$13B) | 18,397 km (~$24B) |
| SSP585 | $51 billion | 12.15 M m² (~$16B) | 28,499 km (~$35B) |
Earlier work had already flagged tens of billions for roads, runways and railroads alone. The new map shows previous inventories undercounted the exposed stock. U.S. national climate and disaster cost tallies and the FEMA National Risk Index still do not treat permafrost thaw as a distinct hazard.
- Houses tipping and roads cracking from differential settlement
- Water pipes failing and clinics left without service
- Sewage lagoons destabilized, with multi-million-dollar repair estimates
- Health clinics requiring relocation as foundations sink
- Overcrowding as safe building sites become scarce and foundations more expensive
These failures hit remote communities with large Native populations first. Many lack the digital property maps needed to seek federal hazard funding.
Road share drives the totals because linear assets cross long stretches of ice-rich ground. A single corridor can lose serviceability in multiple places at once. That pattern turns routine maintenance into repeated capital replacement, which is how per-capita figures climb into the millions in small settlements.
The Tundra Turned Carbon Source
For millennia the Arctic tundra stored carbon. NOAA’s 2024 Arctic Report Card states that when wildfire emissions are included the region has shifted. Circumpolar wildfire emissions have averaged 207 million tons of carbon per year since 2003. The tundra is now a Arctic tundra becoming source of carbon dioxide while remaining a consistent methane source.
A 2024 international study co-authored by NASA scientists examined the broader northern permafrost region from 2000 to 2020. Carbon dioxide uptake by land was largely offset by emissions from lakes, rivers and fires. Methane from wetlands pushed the region into a net contributor to global warming in recent decades on a 20-year global-warming-potential basis.
Abhishek Chatterjee of NASA’s Jet Propulsion Laboratory noted that climate-driven changes are tipping the balance toward a net source. Alaskan permafrost temperatures in 2024 ranked second-warmest on record at long-term stations.
The fire term is decisive in the new balance. Without it, land uptake can still look competitive on paper. With the long-run average of 207 million tons of carbon per year folded in, the sink erodes and the methane contribution from wetlands finishes the shift to net warming on the shorter global-warming-potential horizon.
Abrupt Thaw Changes the Timeline
Gradual top-down thaw is only part of the picture. Abrupt thaw, often linked to thermokarst lakes, ground collapse and hillslope failures, can expose deeper carbon faster than many models assume. Research since 2015 has flagged higher emission rates from these features and from deep lake sediments.
Some newer economic exercises that incorporate updated degradation rates project lower cumulative carbon releases than earlier high-end estimates. Others that add nonlinear Arctic feedbacks find multi-trillion-dollar increases in damage under mid-range pathways. The direction of travel is consistent even when the exact dollar figures move.
Parallel cryosphere stress appears elsewhere. Work on Himalayan glacier melt and nutrient loss shows how high-mountain ice loss can cascade into food webs far downstream. Arctic carbon release operates on a larger atmospheric scale but shares the same pattern of locked material becoming mobile.
- 2015: PAGE09 run adds permafrost CO2 and methane to a business-as-usual path and finds about $43 trillion in extra damage by 2200.
- 2000-2020: Northern permafrost region assessed as a net contributor to warming once wetland methane and fire terms are included.
- 2003 onward: Circumpolar wildfire carbon emissions average 207 million tons per year, eroding the tundra sink.
- 2024: NOAA Arctic Report Card records the tundra CO2 source shift; Alaskan station temperatures rank second-warmest.
- March 2025: Statewide deep-learning map doubles infrastructure counts and prices building and road losses at $37 billion to $51 billion.
Read in sequence, the dates show local damage inventories catching up to a carbon story that models flagged a decade earlier. Abrupt-thaw pathways compress that gap further by moving deep carbon on shorter clocks than top-down thaw alone.
Communities Carry the First Costs
The global models count lost agricultural output, higher cooling demand, health effects, flooding and extreme weather. Those impacts arrive later and diffuse across continents. In Alaska the bill is already local and concentrated.
Residents face mold from damaged homes, contaminated water from failed sanitation, and higher construction costs for permafrost-resilient foundations. Some communities are examining relocation. Indigenous livelihoods tied to caribou, which have declined about 65 percent in large inland herds over recent decades, face additional pressure from changing vegetation and ice conditions.
These results show just how much we need urgent action to slow the melting of the permafrost in order to minimise the scale of the release of greenhouse gases.
Chris Hope said that in 2015. The same logic applies to the infrastructure already cracking underfoot. National disaster accounting that averages weather losses while omitting permafrost leaves the polycrisis under-recognized and under-funded.
| Scale | What is counted | When costs land |
|---|---|---|
| Local (Alaska) | Buildings, roads, clinics, sanitation, relocation pressure | Now through mid-century ($37B-$51B range) |
| Global (PAGE09 path) | Agriculture, cooling, health, flooding, extremes plus permafrost gases | Through 2200 ($43T additional NPV) |
The table is a reminder about discount rates and distance. Trillion-dollar global figures dominate headlines. Million-dollar per-capita hits in remote towns decide whether a clinic stays open this decade.
Why Federal Risk Tools Miss Thaw
U.S. national climate and disaster cost tallies and the FEMA National Risk Index still do not treat permafrost thaw as a distinct hazard. That omission is not a minor bookkeeping gap. It shapes which communities can document exposure and which projects clear funding screens.
The March 2025 inventory makes the mismatch concrete. Deep-learning detection on 0.5 m imagery across 285 communities, joined to OpenStreetMap, produced 53 million square meters of buildings and 50,477 km of roads. Earlier counts on continuous and discontinuous permafrost were roughly half as large. When the exposed stock doubles, any index that never listed the hazard in the first place falls further behind.
Remote towns with large Native populations feel the gap first. Many still lack the digital property maps that federal hazard programs expect as proof. Without those layers, even clear physical damage from differential settlement struggles to enter the same pipelines used for flood or wind claims.
- No distinct permafrost category in the FEMA National Risk Index
- National disaster tallies built around weather averages, not ground ice loss
- Undercounted building and road stock until high-resolution mapping
- Missing digital parcel data in the communities most exposed
Better inventories alone do not move money. They do give agencies a denominated stock to price. Until thaw sits beside flood and fire in the standard tools, the first invoices keep arriving without a matching federal line item.
How Local Damage Connects to Global Ledgers
The $37 billion to $51 billion Alaska range and the $43 trillion global add-on describe the same physical process at two resolutions. One prices foundations and roadbeds between the 2010s and the 2060s. The other prices the atmospheric consequences of released carbon dioxide and methane out to 2200.
Roads dominate the local total at roughly 65 to 69 percent. Carbon dioxide dominates the global add-on at about $33 trillion of the $43 trillion, with methane near $8 trillion. Aggressive cuts in the original model could still avoid as much as $37 trillion of that extra damage. The parallel is plain: slower thaw protects both pavement and the long-run damage function.
Uncertainty remains wide on the global side, from $3 trillion to $166 trillion in the 2015 run. Local engineering costs are narrower because the asset register is finite. That does not make the smaller number safer. It makes it harder to defer.
What Lower Emissions Still Change
The original modeling found that an aggressive emissions-reduction strategy could cut the additional permafrost-related economic impact by as much as $37 trillion relative to the examined pathway. Later work continues to show that stronger near-term mitigation reduces both the volume of carbon released and the scale of adaptation costs.
Even under net-zero trajectories some studies project continued ecosystem carbon loss from permafrost for decades because of committed warming and the slow response of deep ground. That makes early cuts more valuable, not less. Monitoring networks, better infrastructure inventories and inclusion of permafrost in national risk tools would give communities clearer numbers for planning.
The tundra still looks quiet from the air. Under the moss the frozen carbon is waking and the roads are already moving. The first invoices are arriving in Alaska while the century-scale ledger remains open.