Indian Institute of Astrophysics scientists using Aditya-L1 data report that surface-generated waves supplied only 7 percent of the energy needed in eruption zones of the Sun’s corona, while magnetic reconnection and field reconfiguration supplied the rest. The finding comes from Visible Emission Line Coronagraph observations of a coronal mass ejection on 5 August 2024 and appears in The Astrophysical Journal Letters.
The result gives modelers a direct observational number for a process long simulated on computers, and it points to how the corona can refill energy lost in the eruptions that drive space weather at Earth.
That partition is not an abstract curiosity. It ties the century-old coronal heating problem to the practical clock of post-eruption recovery, and it does so with numbers that can be checked against the same continuous data stream as more events arrive.
A Green Line First Spotted in 1869
The coronal heating problem is older than modern solar physics. During the total solar eclipse of 1869, American astronomers recorded a mysterious green spectral line in the Sun’s outer atmosphere. They attributed it to a new element they named coronium.
Seventy years later Swedish physicist Bengt Edlén showed the line belonged to iron atoms stripped of nearly half their electrons. That ionization state requires temperatures above one million degrees Celsius, roughly 150 times hotter than the visible solar surface of about 6,000 degrees.
- 1869: Green coronal line recorded at eclipse; “coronium” proposed.
- 1930s-1940s: Edlén identifies highly ionized iron; million-degree corona confirmed.
- Decades since: Two leading heat candidates compete, waves from surface convection and magnetic reconnection.
- 2023-2024: Aditya-L1 reaches L1 and begins continuous coronal spectroscopy with VELC.
- 2026: IIA team publishes quantitative energy split from one well-observed CME.
The corona also sheds energy constantly through radiation and mass ejections. Any heating solution must also explain rapid replenishment.
The green Fe XIV line that once defined an imaginary element is now the diagnostic channel VELC uses day after day. Continuity of that spectral window, from eclipse sketches to space-borne spectroscopy, is what lets a modern energy budget be stated in percentages rather than qualitative arguments.
Replenishment is the other half of the puzzle. Heat that only arrives slowly cannot keep pace with eruptions that empty and restructure large volumes of the corona on timescales of hours. The August event supplied a measured refill interval against which those older ideas can be tested.
What the Coronagraph Caught on 5 August
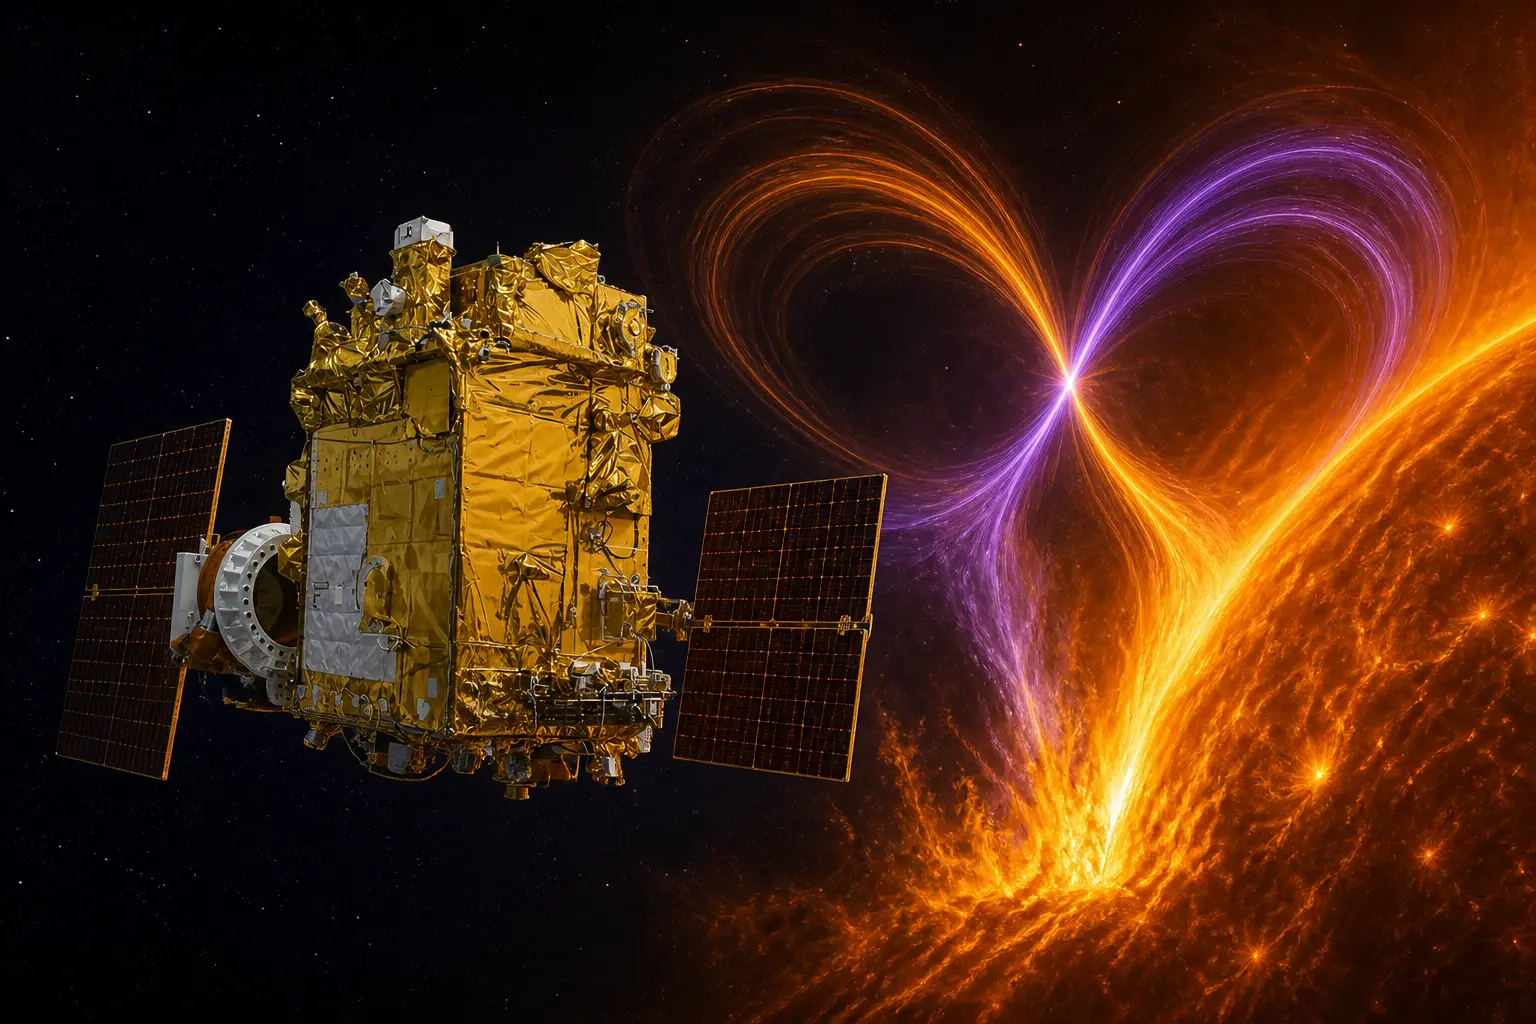
Aditya-L1 sits in a halo orbit around the L1 point roughly 1.5 million km sunward of Earth, giving an uninterrupted view of the solar disk and corona. Its primary payload, the Visible Emission Line Coronagraph built by IIA, images and takes spectra in the green Fe XIV 5303 Å line from 1.05 to about 1.5 solar radii.
On 5 August 2024 VELC recorded a powerful CME. Within roughly 10 hours the tangled magnetic field lines near the source region had largely returned toward their pre-eruption configuration through reconnection. Researchers led by senior professor R. Ramesh then calculated the energy contributions of the two classic mechanisms in the affected volume.
- Surface waves: ~7 percent of the energy requirement
- Magnetic reconfiguration: ~93 percent
- Recovery timescale: about 10 hours after the CME
- Instrument: VELC sit-and-stare spectroscopy in 5303 Å
Earlier VELC work on a 16 July 2024 event had already shown intensity drops from mass depletion, line-width increases, and non-thermal motions consistent with enhanced turbulence after eruption.
Sit-and-stare spectroscopy holds the slit on a fixed coronal region so that intensity, width and Doppler signals can be tracked as the eruption and its aftermath unfold. That mode is what turned a single CME into a closed energy ledger rather than a sequence of images alone.
The July observations did not yet yield the percentage split. They did establish that mass left the line of sight, that motions became more turbulent, and that the plasma diagnostics were sensitive enough to quantify those changes when a fuller analysis became possible in August.
Waves Carry Little; Fields Do the Heavy Lifting
For decades theorists have known both channels can deliver heat. Plasma convection at the surface launches magneto-acoustic and Alfvén waves that propagate upward and dissipate. Separately, magnetic field lines become stressed by photospheric motions, store free energy, then snap and reconnect, converting magnetic energy into heat, bulk flows and particle acceleration.
The new analysis puts hard percentages on the balance in CME-active regions.
| Mechanism | Estimated share of energy | Primary process |
|---|---|---|
| Surface-generated waves | 7 percent | Upward propagation and dissipation of MHD waves |
| Magnetic reconnection and reconfiguration | 93 percent | Field-line snapping, energy release and rapid re-assembly |
“Though the waves generated as a result of the bubbling, boiling motions on the Sun’s surface generate and transport energy, their contribution is very little, they supply only 7% of the energy requirement,” Ramesh said. “The remaining 93% comes because the Sun reconfigures itself and replenishes the lost energy.”
Related line-width increases after two limb CMEs support the picture of enhanced turbulence once the magnetic topology is disrupted and then reforms.
Wave heating remains real physics. In quiet regions or at heights where reconnection is rare it may still dominate local budgets. The IIA result applies to eruption zones, where free magnetic energy is abundant and the field is already being violently rearranged. There the ledger tilts almost entirely toward reconnection and reconfiguration.
The turbulence signature matters because it links the energy release to observable line widths. When topology reforms, non-thermal motions rise; those motions are a measurable footprint of the same process that supplies the bulk of the heat.
One Event, a Clear Benchmark
Solar physicist Dibyendu Nandi of the Raman Research Institute, who was not part of the study, noted the unique continuous coverage Aditya-L1 provides. He also stressed the current limit: the quantitative split rests on a single well-observed CME from August 2024.
Establishing whether the results hold over a statistically significant number of events would be an important future step.
Nandi told The Telegraph the work already demonstrates what the instrument can do. The IIA team has said it will extend the same analysis to additional CMEs. Earlier VELC spectroscopic observations of CME onset on 16 July 2024 had already constrained timing, intensity drop of about 50 percent, line-width rise of about 15 percent, and a non-thermal velocity near 25 km per second.
The single-event nature does not erase the value of a concrete energy partition. Models that previously relied on free parameters now have an observational target in eruption regions.
| Diagnostic from July 2024 CME | Reported change |
|---|---|
| Intensity | Drop of about 50 percent |
| Line width | Rise of about 15 percent |
| Non-thermal velocity | Near 25 km per second |
Those July figures describe the disturbed state just after onset. The August analysis goes further by converting the recovery into an energy share between waves and fields. Together the two events show a path from qualitative signs of turbulence to a quantitative heating budget.
A benchmark of 7 versus 93 percent will not freeze theory in place. It gives simulators a number they must either reproduce in eruption-zone runs or explain away with clearer assumptions about volume, filling factor and time window.
Earth Feels the Same Magnetic Engine
CMEs and the magnetic restructuring that drives them are the root of most severe space weather. Quiet-Sun periods produce one or two CMEs per day; at solar maximum the rate can exceed ten. When a CME’s magnetic field and plasma reach Earth they can induce geomagnetic storms that disturb satellites, radio links, GNSS navigation and high-voltage power grids.
- Satellite drag and single-event upsets rise during storms
- High-frequency radio and GPS accuracy degrade
- Geomagnetically induced currents stress transformers
- Airline polar routes and polar science face radiation and communication limits
If reconnection both powers the bulk of coronal heating and rapidly rebuilds the field after each ejection, then the same physics that keeps the corona hot also sets the recovery clock for the next eruption cycle. Better observational constraints on that clock feed directly into the lead time and severity estimates used by space-weather services.
A roughly 10-hour return toward pre-eruption configuration is short compared with the multi-day travel time of many CMEs to Earth. That mismatch means the Sun can already be rebuilding while earlier ejecta are still en route, a cadence space-weather models must absorb if they are to track successive events rather than isolated blasts.
How Recovery Time Shapes the Next Cycle
The energy split and the recovery interval are two faces of one process. When reconnection supplies about 93 percent of the heat in the affected volume, it is also the agent that re-assembles open and closed field lines after they have been blown outward.
That dual role tightens the link between coronal maintenance and eruptive readiness. A corona that refills mainly by reconfiguration does not wait on a slow trickle of wave energy before it can store free energy again. The same snapping and rejoining that heats the plasma resets the topology that will stress and erupt later.
- Pre-eruption: Stressed fields store free energy above the surface.
- CME onset: Topology disrupts; mass and magnetic flux leave the region.
- Hours after: Reconnection rebuilds connectivity; turbulence and line widths rise.
- About 10 hours: Configuration trends back toward the pre-event state.
- Thereafter: Fresh stressing can accumulate toward the next ejection.
Services that forecast storm severity already watch CME speed, direction and magnetic orientation. Adding an observationally grounded refill timescale gives them a handle on how quickly a source region might contribute again during active stretches of the solar cycle.
The IIA percentages do not replace those solar-wind and magnetospheric inputs. They anchor the solar end of the chain in measured coronal physics rather than in adjustable heating terms alone.
Why Continuous Spectra Beat Eclipse Snapshots
Eclipse campaigns and ground coronagraphs still deliver sharp views and rare total-sun context. They cannot stare at one source region through an entire eruption and its multi-hour recovery. Weather, darkness and the brief minutes of totality break the time series that energy accounting requires.
VELC’s internally occulted design and L1 vantage remove those gaps. Intensity, width and Doppler shifts in the same Fe XIV line can be followed from the first mass depletion through the return of ordered structure. That continuity is what allowed the team to move from “reconnection matters” to “reconnection supplied about 93 percent in this volume.”
- No day-night cycle at L1 to interrupt the light curve
- No Earth eclipse of the spacecraft’s solar view
- Spectroscopy close to the limb, from 1.05 solar radii outward
- Simultaneous imaging to locate the slit relative to the CME structure
ISRO lists coronal heating, CME initiation and magnetic-field topology among the mission’s core science goals. Meeting those goals depends less on any single spectacular image than on unbroken spectral records of ordinary and powerful events alike.
Aditya-L1 Keeps Watching Without Eclipse
Ground-based coronagraphs and eclipse expeditions still matter, yet they cannot match uninterrupted cadence. From L1 the spacecraft views the Sun continuously. VELC’s combination of imaging and multi-line spectroscopy close to the limb supplies the plasma diagnostics, intensity, width and Doppler shifts, needed to separate thermal, non-thermal and bulk-motion contributions.
ISRO lists coronal heating, CME initiation and magnetic-field topology among the mission’s core science goals. The new energy-partition result is one of the clearest early payoffs from that design. As the solar cycle continues and more events accumulate, the statistical sample Nandi called for will grow from the same continuous data stream.
The corona remains hotter than the surface beneath it. The magnetic dance that Indian researchers have now timed and weighed supplies most of the heat and most of the refill.
Each additional CME run through the same reduction will test whether 7 and 93 percent are typical of eruption zones or a property of this August case alone. Until that verdict arrives, modelers already have a sharper target than free parameters, and forecasters have a clearer physical story for why the corona both stays hot and recovers fast.
Frequently Asked Questions
What is the coronal heating problem?
It is the long-standing observation that the Sun’s outer atmosphere reaches roughly one to two million degrees Celsius (and far higher in flares) while the visible photosphere sits near 5,500-6,000 degrees, an inversion that ordinary thermodynamic gradients cannot explain and that requires continuous energy input against radiative and eruptive losses.
How hot is the solar corona compared with the surface?
Typical quiet-corona temperatures are about one million degrees Celsius, rising to tens of millions during major eruptions, while the photosphere is only about 6,000 degrees, a factor of roughly 150 or more.
What share of coronal energy did the Aditya-L1 study assign to waves versus magnetic reconnection?
In the regions of the analysed August 2024 CME, surface-generated waves accounted for approximately 7 percent of the required energy and magnetic-field reconfiguration and reconnection for approximately 93 percent, according to the IIA team’s published analysis.
What does the VELC instrument on Aditya-L1 measure?
VELC is an internally occulted coronagraph that performs simultaneous imaging and spectroscopy of the corona in emission lines including Fe XIV 5303 Å from 1.05 solar radii outward, yielding intensity, line width and Doppler velocity diagnostics of plasma conditions and dynamics.
Why is the L1 vantage point useful for solar observations?
A spacecraft in halo orbit around the Sun-Earth L1 point has a continuous, unobstructed view of the Sun with no day-night cycle or eclipses by Earth, allowing uninterrupted tracking of evolving coronal structures and eruptions.