Georgia’s industrial producer price index rose 5.9% year-on-year in June, down from 7.1% in May, while prices slipped 0.8% on the month, according to the National Statistics Office of Georgia (Geostat). Mining and quarrying, where metal ore prices climbed 19.6%, still grabs the headline. But that sector’s growth rate is collapsing month after month, and electricity is quietly stepping in as the index’s real engine.
That handoff matters more than another data point suggests. A mining boom mostly pays exporters and the state budget. An electricity bill lands on every household and factory floor in the country, right as Georgians absorb one of the steepest power tariff increases in years.
Mining’s Price Surge Is Losing Its Grip
A month earlier, Geostat’s own May report told a hotter story: producer prices up 7.1% annually, with mining and quarrying surging 24.6% and metal ore alone up 29.7%. By June, mining had cooled to 15.3% and metal ore to 19.6%. Both are still big numbers. Both are decelerating fast.
| Segment | May 2026 (Year-on-Year) | June 2026 (Year-on-Year) | Change |
|---|---|---|---|
| Headline PPI | 7.1% | 5.9% | -1.2 pts |
| Mining and quarrying | 24.6% | 15.3% | -9.3 pts |
| Metal ore | 29.7% | 19.6% | -10.1 pts |
| Manufacturing | 6.5% | 5.2% | -1.3 pts |
| Electricity, gas, steam and air conditioning | 1.0% | 4.4% | +3.4 pts |
| Water supply and sewerage | 6.4% | 6.7% | +0.3 pts |
One correction to the popular reading: manufacturing, not mining, still supplies most of the headline number. It simply carries more weight in the basket. Its 5.2% price rise added 4.19 percentage points to June’s index, more than four times mining’s 1.04-point contribution. Food products rose 5.8% and basic metals climbed 10.6% within that manufacturing line.
Mining’s monthly path is the sharper tell. Prices in the sector fell just 0.5% from April to May. From May to June, they dropped 5.8%, dragging the overall index down 0.45 points on their own. A slowdown that started gently is now falling off a ledge.
Why Is Electricity Suddenly Driving Georgia’s Prices?
Electricity, gas, steam and air conditioning prices rose 4.4% year-on-year in June, up from just 1.0% in May, and jumped 3.3% on the month alone after falling 4.8% the month before. The reversal traces back to a regulator-approved tariff increase that took effect April 1, plus Georgia’s growing bill for imported power.
The Georgian National Energy and Water Supply Regulatory Commission (GNERC) approved new electricity rates at a March 30 session. Household tariffs climbed between 18% and 34% depending on consumption band, an average of roughly 27%. In the lowest bracket, up to 101 kilowatt-hours a month, the rate climbed from 0.15041 to 0.20041 GEL per kWh, a jump of more than 30%. Business tariffs rose separately, by 4 to 7 tetri per kilowatt-hour, or about 20% on average.
Several forces pushed the increase through:
- Removal of state gas subsidies that had kept thermal power plants’ costs down
- Costlier electricity imports as domestic hydropower output slips
- Expiry of government-set contracts at the Khrami 1 and Khrami 2 plants, which shifted onto GNERC-regulated pricing
- Recovery of roughly 2 billion lari (about $746 million) in planned distribution-network investment
The regulator was not always sold on the need for an increase. In December, GNERC had extended the old rates for three months instead of raising them.
The factors that could justify a tariff hike are not present, so the current rates will be maintained.
GNERC chairman Davit Narmania said that in December, four months before the commission approved the increase it had just ruled out.
Consumer Inflation Is Tracking the Same Shift
Geostat’s separate inflation report put Georgia’s annual consumer price growth at 5.8% in June, with monthly inflation of just 0.1%. Core inflation, which strips out volatile items, ran cooler at 3.5%, and core inflation excluding tobacco stood at 3.2%.
The housing and utilities line shows the sharper story. It sat at just 0.6% annual inflation in March, before the tariff decision took hold. It jumped to 6.5% in April and reached 7.0% by May, the fastest-accelerating major category in the entire consumer basket.
The central bank has been responding in kind. The National Bank of Georgia lifted its policy rate by 25 basis points to 8.25% in April, its first hike since March 2022, pointing to a supply shock tied to the conflict in the Middle East. It held that rate steady at its June meeting. Its inflation target is 3%; it now expects headline inflation to average 4.9% across all of 2026.
- 5.9% – June’s annual rise in factory-gate prices, down from 7.1% in May
- 5.8% – Georgia’s annual consumer inflation rate in June, per Geostat’s separate report
- 8.25% – the National Bank of Georgia’s policy rate, held steady since April’s hike
- 27% – the average increase in household electricity tariffs GNERC approved for April 1
Read together, the two reports are converging in an unusual way. Producer prices and consumer prices are only a tenth of a point apart, a narrower gap than the historical pattern, since factory-gate costs tend to swing wider than what actually reaches a checkout counter.
The Gains and the Bill Land on Different Desks
Georgia’s metal ore windfall flows to a narrow group: exporters, mine operators, and the state through royalties and taxes. The electricity increase does not discriminate that way. It touches every producer sector in the index, every business that runs machinery, and every household with a meter.
Georgians already had reason to feel squeezed before this year’s tariff decision. Taxi fares here rank second highest among the country’s neighbors, a regional cost gap that predates the power increase and now sits alongside it.
Manufacturers caught in the middle face their own version of the squeeze. June’s manufacturing prices actually fell 0.9% on the month, even as electricity, one of their key input costs, rose 3.3%. Producers are absorbing higher power costs faster than they can pass along higher prices for what they make.
What Geostat Actually Counts, Sector by Sector
Geostat’s producer price index follows the international NACE classification across four sections: mining and quarrying, manufacturing, electricity/gas/steam/air conditioning supply, and water supply, sewerage and waste management. 6,665 monthly price data points from 1,902 organizations feed the calculation nationwide, collected by field enumerators on the same date every month.
The distinction from the consumer price index is straightforward. PPI tracks what a mine, factory or utility charges at the gate. CPI tracks what actually lands on a household’s receipt, once retail margins, transport and taxes are added. PPI usually leads CPI by weeks or months, which is one reason June’s producer-side deceleration is worth watching against consumer inflation later in the year.
The same regulator behind the electricity increase also sets water tariffs, which is relevant to the water supply and sewerage line’s 6.7% annual rise. One water rate is locked in through January 2028 in a former license area once held by Akriani 2006 LLC, a reminder that tariff decisions here often run years, not months, ahead.
The Rest of the Year Turns on Rain and Metal Prices
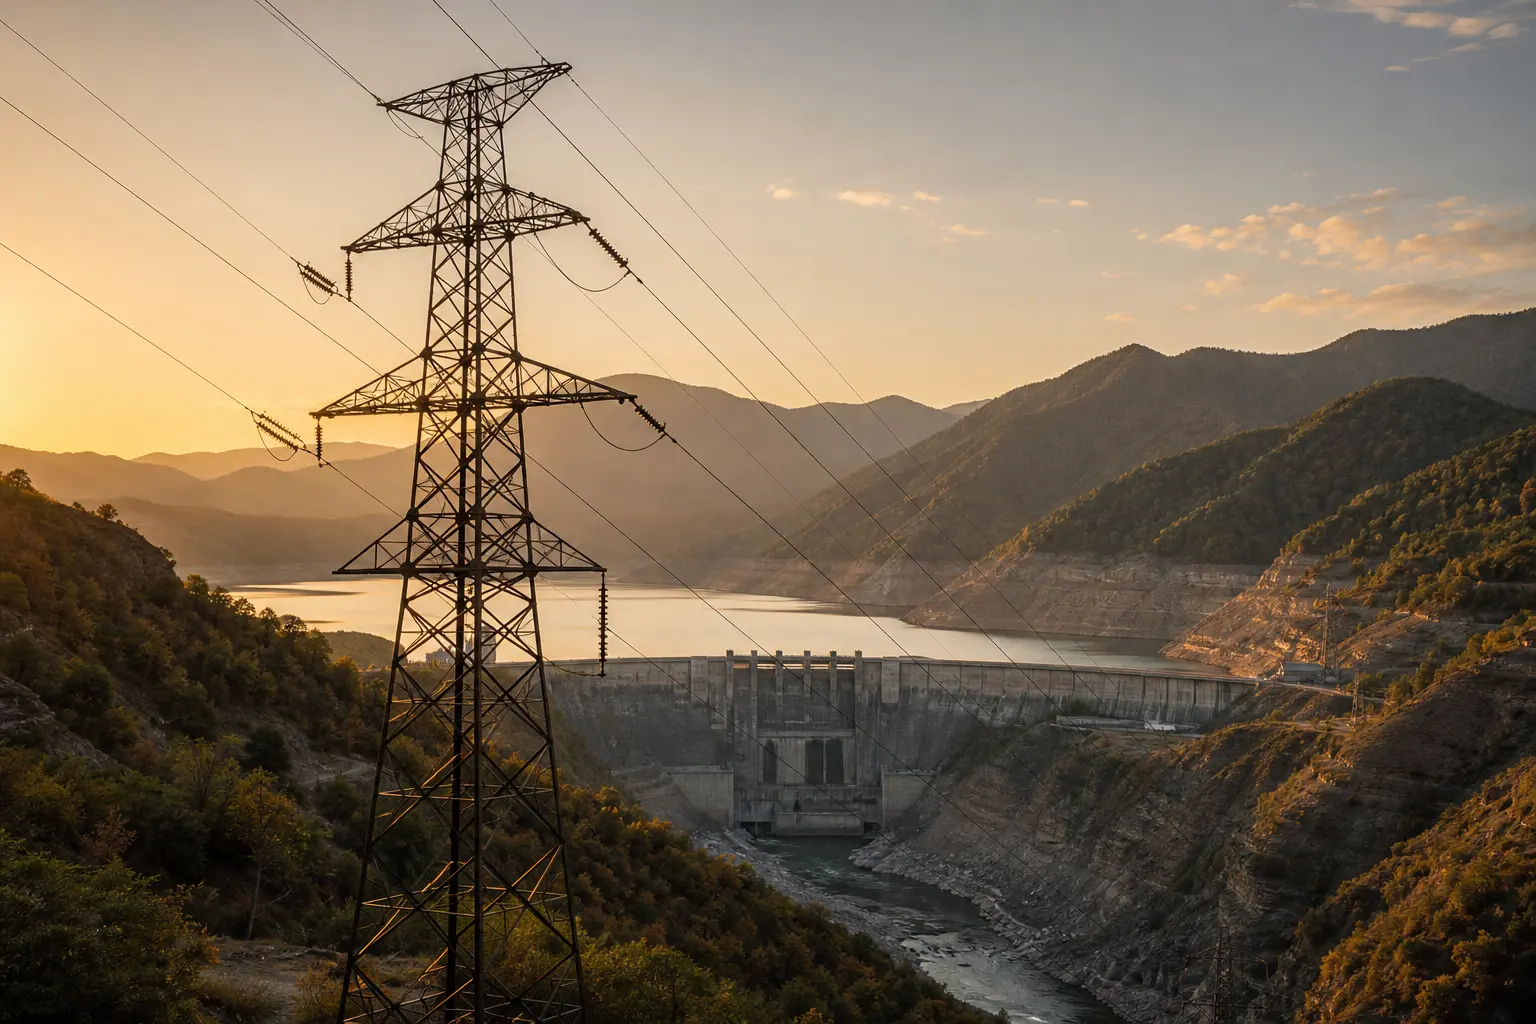
Hydropower supplies about 80% of Georgia’s electricity generation, according to the International Energy Agency, which makes the producer price index for electricity partly a bet on rainfall. Domestic hydropower generation fell 3.1% in 2025 on reduced precipitation, pushing the country toward pricier imports. Georgia spent $37.6 million on 1.1 billion kilowatt-hours of imported electricity in the first four months of 2026 alone, according to Georgian business outlet BM.ge.
Mining’s fate hinges on a different variable entirely: global metal prices, which have run hot for two years and now show the first real signs of cresting in Georgia’s own data. If that cooling continues, mining’s share of the headline number keeps shrinking while electricity’s keeps growing, a full changing of the guard inside a single statistical release.
Geostat’s next reading, covering July, is due in mid-August. It will be the first real test of whether electricity keeps climbing as mining keeps sliding.
Frequently Asked Questions
What Does Georgia’s Producer Price Index Actually Measure?
It tracks prices that Georgian mines, factories, utilities and water companies charge before goods and services reach a shop shelf or a household meter. The index covers four sectors under international NACE classification: mining and quarrying, manufacturing, electricity/gas/steam/air conditioning, and water supply and sewerage. Geostat builds it from thousands of monthly price reports gathered directly from producing organizations across the country.
Why Is Georgia’s Consumer Inflation Rate Running Below Its Producer Price Index?
Producer prices reflect costs at the factory or utility gate, before retail markups, transport and taxes are added, and before businesses decide how much of a cost increase they can pass on to shoppers. That is why PPI often leads CPI by weeks or months. June’s narrowing gap between a 5.9% PPI and a 5.8% CPI suggests less of a buffer than usual between what producers pay and what consumers eventually see.
Does Georgia’s Electricity Tariff Increase Affect Businesses as Well as Households?
Yes, on a separate schedule. Household electricity rates rose 18% to 34% depending on consumption band, averaging about 27%, while business tariffs increased by 4 to 7 tetri per kilowatt-hour, roughly 20% on average, under the same GNERC decision that took effect April 1.
Why Might Georgia’s Electricity Costs Keep Climbing Later This Year?
Georgia’s hydropower output is seasonal, and gas and electricity imports typically rise in the winter months, when hydropower capacity drops and heating demand climbs. With hydropower already down 3.1% in 2025 on lower rainfall, a dry autumn could push import costs, and the producer price index’s electricity component, higher again before year-end.